Twin-Twin Deficit
|
There is a national consensus that India’s combined fiscal deficit must reduce significantly. The question that arises is how this laudable aspiration can be achieved. There are four important structural changes that have taken place over the last 10 years that will significantly impact our answers.
1. Indian States, taken together, have for some time been in much better fiscal health than the Centre.
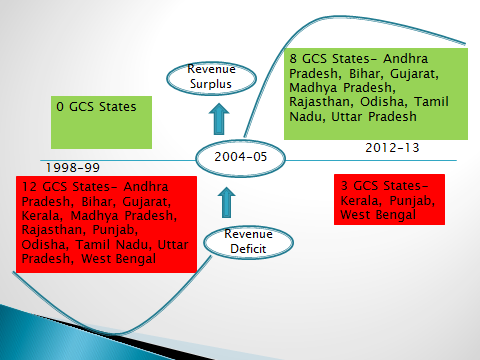
Since 1978-79, the Government of India has been running a revenue deficit. This averaged 1.7% of GDP between 1979-91, 2.9% between 1991-2008 and 4.1% between 2008-2013. The States1 have also been consistently running revenue deficits from 1985-86. These grew exponentially from 0.1% in 1986-87 to 3.45 of GSDP in 2001. However, after 2003-04, the macro-fiscal position of the States improved dramatically and the States have been running a balanced revenue budget since 2008-09. If one excludes Kerala, Punjab, and West Bengal, the remaining States have been running fairly healthy revenue surpluses2. This is as true for rich States like Maharashtra and Gujarat, as for poorer States like Bihar, Orissa, and UP.
It has been argued that this improvement in State Finances is significantly due to increases in central transfers. This is not true. Central transfers as a percentage of GSDP over the past three years have been far lower than in the 80s and 90s. Thus, improvements in own revenue performance and expenditure management have led to this turnaround in the macro-fiscal position of the States.
2. The Centre has for some time not been the locus for public investment, which is principally undertaken by the States.
Since the States have secured a revenue surplus, their fiscal deficit is entirely used for public investment. The Centre since 2007-08 has been investing between 1 to 1.5% of the GDP; this includes investment in defence. From 2000-01 the Central Plan capital outlay has declined from 47% of the total plan expenditure to 20.4% in 2012-13. At the same time, the States have been consistently investing 2.5% of their GSDP. Even a poor state like Bihar has been consistently investing 5% of its GSDP since 2007-08. Thus the “heavy lifting” in terms of public investment is being done by the States.
3. India spends too little on human development and spends it badly. This imposes a political economy constraint on deficit reduction.
Since the beginning of the millennium the focus of Central Government public spending has been on human development. In itself, this is laudable as long as spending by the centre is (a) sufficient (b) what is spent results in
|
delivery of public services. Both these statements have not been true for India. India spends 3.9% of its GDP on public health expenditure as opposed to 4.5% in Kenya and 5.4% in Nepal. India’s public spending on education was 3.2% in 2011 compared to 4.7% in Nepal and 6.7% in Kenya. Regrettably, what is spent, is spent badly. Out of 12 human and economic development targets of the 11th Plan, only 1 was achieved.
This imposes a political economy constraint on deficit reduction. Stakeholders for human development are aware of both these features of public spending. However, the opacity of the public service delivery mechanism makes advocacy for improving the efficacy of public spending difficult. It is easier and politically popular to argue that more should be spent even though all concerned are aware that this spending will not be effective. Hence, if the government was to reduce spending on a fiscal “bad” like food subsidy, this reduction will, in large measure, be nullified by expenditure switching but, on current pattern, such expenditure switching will not bring about the desired development results.
4. The structure of Indian Savings further constrains available resources
From 1981 to 2011 household savings increased from 10.8% to 22.3% of GDP. Corporate savings contributed between 1.5 to 7 percent of GDP in the same period. This, prima facie, provides a sizeable pool of resources for investment in growth. However, in the same period, the share of physical savings has grown from 5% of GDP to 14.3% of GDP. With the government borrowing to consume by running a persistent revenue deficit, not more than 10.8 per cent of GDP was available for investment in 2011-12.
Policy options:
Addressing the twin deficits requires emphatic policy measures. These are:
If these emphatic measures in some combination are not implemented urgently then growth at or above 8% can only be secured by tolerating higher (ultimately un-sustainable) inflation and an increasing current account deficit. Piecemeal measures to enhance revenues or cut ‘bad’ public expenditure will not do the trick.
Data Sources:
|


