Targeting Debt and Deficits in India
SUKANYA BOSE, Associate Professor, National Institute of Public Finance and Policy, New Delhi, India. email:sukanya.bose@nipfp.org.in
PARMA DEVI ADHIKARI, Project Associate, National Institute of Public Finance and Policy, New Delhi, India.. email:parma.adhikari@nipfp.org.in
|
Global financial crisis and other factors caused a temporary pause in fiscal consolidation.
Consequent to the buoyant economic growth and revenues in the years since 2003-04, fiscal rules brought about substantial improvements in fiscal balances. However, the global financial crisis, slowdown in domestic growth and need for countercyclical fiscal stimulus caused a temporary pause in fiscal consolidation. Subsequently, the 13th Finance Commission revised the targets and reiterated elimination of the revenue deficit as the long term and permanent target for the government. For the Centre, the target for fiscal deficit was 3 per cent of GDP and for the States it was 2.4 per cent of GDP by 2014-15. With the slippage in these targets essentially due to fall in the GDP growth as well as due to irreversibility of some of the fiscal stimulus measures there was a need to revise the fiscal consolidation roadmap. This was one of the terms of reference for the 14th Finance Commission.
Given this context, we in Bhanumurthy, N.R., Sukanya Bose and Parma Devi Adhikari (2015), relook at the linkages between macro-fiscal issues and analyse over the 14th Finance Commission period of 2015-19 with the help of a structural macroeconometric model. Specific issues that are analysed are (a) impact of 7th Pay Commission award (Scenario 1), (b) possibility of achieving higher growth and (Scenario 2) and (c) targeting deficit and debt (Scenario 3). The macro-econometric model consists of five blocks: real sector block, external sector block, fiscal block, monetary block and macroeconomic block. The model has been estimated using annual data for the period 1991-92 to 2012-13, taking care of time series properties.
The outcomes can be understood in three scenarios.
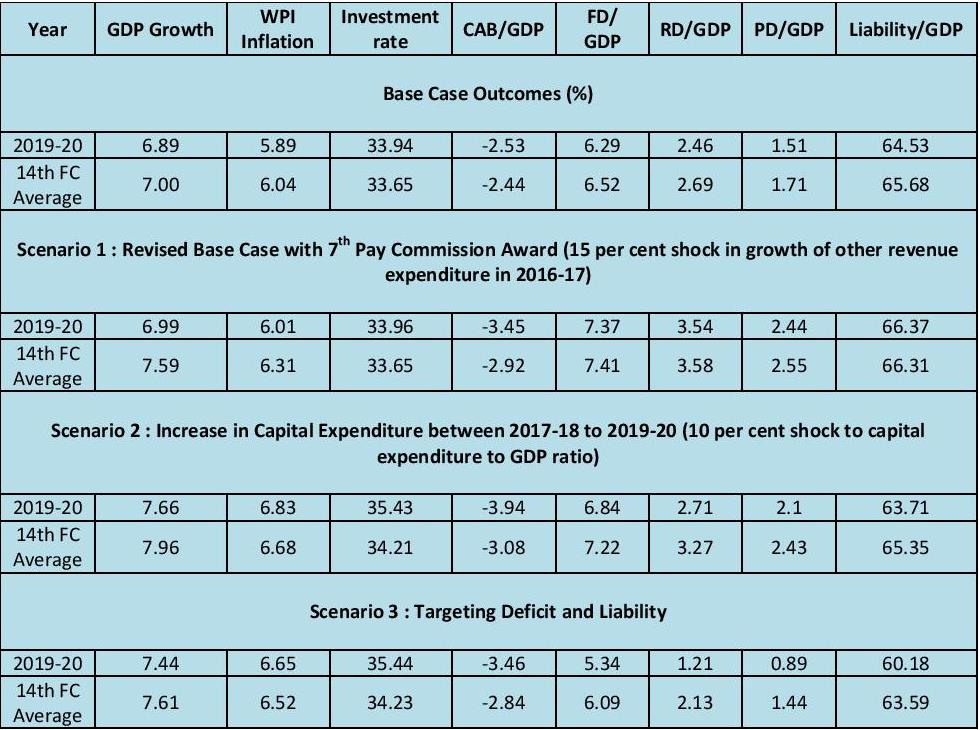
In the baseline scenario as shown in table 1, the average GDP growth over the 14th Finance Commission period is expected to be 7 per cent, with inflation moderating to about 6 per cent on an average. The investment rate in the economy rises to 34 per cent by the terminal year. Besides the recovery in domestic investment, the overall recovery in growth in the 14th Finance Commission period is driven by the assumption in external sector growth (US growth, other advanced country growth and world GDP growth), which is expected to revive as per the IMF projections. Current account deficit to GDP is, however, contained at less than 2.5 per cent of GDP, on an average. This could be largely due to assumption of lower world oil prices. There is an improvement in the fiscal indicators as well. Revenue balance improves as a percentage of GDP which reduces the fiscal deficit to GDP ratio. Improvement in fiscal deficit along with higher growth is responsible for lower liability-GDP ratios by the end of the period.
Table 1: Comparison of simulation results
|
Scenario 1: Revised Base Case with 7th Pay Commission Award (15 per cent shock in growth of other revenue expenditure in 2016-17)
In the case of 7th Pay Commission award, a shock of 15 per cent in the growth of other revenue expenditures[1] is assumed for 2016-17, the year of announcement of the Pay Commission award. Compared to the base case, an increase in real growth by 0.6 per cent along with higher inflation of 0.3 per cent is expected, on an average. Revenue deficit and the fiscal deficit expected to rise by 0.9 per cent of GDP compared to the base case. Liability[2] as a ratio to GDP is expected to increase by two percentage points by the terminal year.
Scenario 2: Increase in Capital Expenditure between 2017-18 to 2019-20 (10 per cent shock to capital expenditure to GDP ratio)
To achieve higher growth, public capital expenditure is increased from 2017-18 as the fiscal space for increase in capital expenditure is limited until then due to higher allocation for revenue expenditure following 7th Pay award in 2016-17. Increase in capital expenditure is found to be growth and investment rate enhancing[3]. The current account deficit widens marginally and fiscal indicators improve due to higher growth and higher revenue collections.
Scenario 3: Targeting Deficit and Liability
Scenario 3 suggests an expenditure switching policy, which is the core of expansionary fiscal consolidation mechanism, of increasing higher government capital expenditure and reducing the government transfers. This policy could result in higher growth with a manageable fiscal deficit of 5.3 per cent that also brings down the government (centre plus states) liability to around 60 per cent by 2019-20. This strategy is expected to result in better outcomes in all other macroeconomic indicators as well. Significantly, the analysis also suggests that crowding-out impact of government revenue expenditures is ambiguous as the interest rate channel monetary transmission mechanism itself appears to be weak in the post-crisis period.
Conclusion
The objective of higher economic growth with lower deficits, while at the same time accommodating the 7th Pay Commission award, can be best served through an expenditure switching policy favouring higher capital expenditure.
References
[1] Other Revenue Expenditure is determined residually by subtracting Interest Payments and Transfers from Revenue Expenditure.
[2] Liability and debt are used interchangeably.
[3] These results are consistent with the findings of Bose & Bhanumurthy (2015)
|


