How to Anchor Inflation Expectations in India?
RUDRANI BHATTACHARYA, Associate Professor, National Institute of Public Finance and Policy, New Delhi, India. email:rudrani.bhattacharya@nipfp.org.in
|
Persistently high inflation has been a major concern in India, with headline inflation measured by the Wholesale Price Index (WPI) hovering over RBI’s target level of 5% for the last five years. The year-on-year (YOY) inflation in WPI averaged 8% during December, 2009 to March, 2014, and surged over 10% during mid -2010.
Monetary policy in India has moved towards an increasingly flexible exchange rate regime (Zeileis et al., 2010), without any explicit framework for an alternative nominal anchor. In absence of an appropriate nominal anchor, inflation expectations remained persistently high during 2008 to mid-2014, over 10% on average. The failure of monetary policy to anchor inflationary expectations of agents, coupled with negative supply shocks contributed to high and persistent inflationary pressure in the country for last five years.
Bhattacharya and Patnaik (2014) – on which this One Pager is based- present a semi-structural new- Keynesian model following Laxton et al. (2009) for India that provides insights in the setting of an inflation targeting framework to anchor inflationary expectations. The model features micro-founded aggregate demand and supply conditions, uncovered interest parity condition determining the exchange rate dynamics, and central bank’s reaction function to evaluate the monetary policy stance appropriate to the expected inflation in India. This framework offers an understanding of the extent to which various shocks, including the post-global crisis fiscal stimulus, accommodative monetary policy and ensuing decline in global demand, explain growth and inflation in India.
The paper finds strong aggregate demand channel of monetary policy transmission in India and shows that the policy rate, during early phase of the post-global crisis period, was significantly below the interest rate predicted by the inflation targeting monetary policy rule of the central bank. The impulse responses from the model calibrated to Indian data, suggest that a rise in the policy rate dampens aggregate demand through intertemporal substitution of consumption and by reducing investment demand. The contraction in demand reduces inflation via forward-looking behaviour of producers.
Figure 1. Actual versus rule-based monetary policy stance and dynamics of expected inflation under inflation targeting rule
Moreover, historical decompositions of key macroeconomic variables in the study suggest that post-crisis fiscal stimulus raised aggregate economic activity above its long term trend since Q1, 2010. This has outweighed the negative effects on exports from declining global demand, compounded by real exchange rate appreciation. The net effect was high enough to sustain a positive output gap till the beginning of 2012. |
However, high positive domestic demand coupled with accommodative monetary policy and supply-side pressures, resulted in unanchored inflationary expectations. This contributed significantly to sustained inflationary pressure above the central bank’s acceptable level of 5% since Q2, 2009.
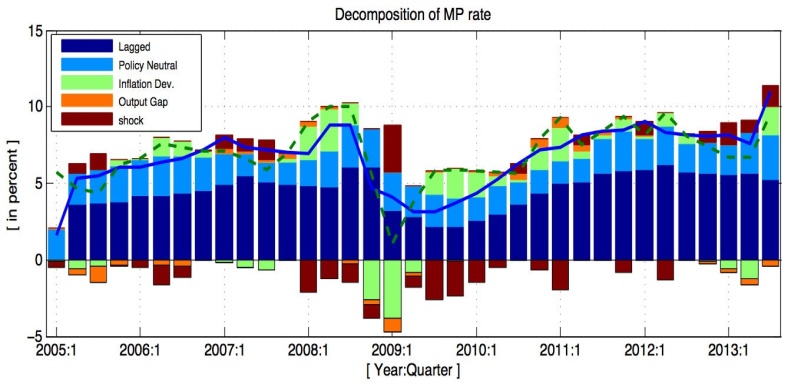
Monetary policy remained accommodative during the rebound of WPI inflation close to 5% and above from Q4, 2009. Both the repo and the reverse repo rates declined sharply, with the call money rate touching the floor of the interest rate corridor. As a consequence, the yield on the 91-day Treasury Bill rate, which is seen as the summary statistic of monetary policy stance, remained low (see the blue line in the upper panel of Figure 1) as well. However, given the macroeconomic conditions in this period, the model predicts a higher policy rate during Q1, 2009–Q1, 2011, under the inflation targeting scenario (see the green dotted line in the upper panel of Figure 1). Monetary policy was tightened with a delay in 2011–12, raising rates to that consistent with the Taylor rule from Q2, 2011.
The question of anchoring inflation expectations depends on two critical factors: the magnitude and the timeliness of the response to prevailing inflationary conditions. The divergence between the actual and the rule-based monetary policy stance reflects the monetary authority’s failure to anchor inflation expectations in a timely and effective manner.
The in-sample forecast during Q4, 2009 to Q4, 2013, in this counter-factual inflation targeting framework, predicts a moderate and stable rate of inflation (5.03% on average, shown by the green line in the lower panel of Figure 1) compared to the actual high inflation scenario (6.59%, on average, shown by the black line) in this period. Moreover, the predicted average expected inflation rate (see the red dotted line in Figure 1) is 4.82%, which is much below the survey-based average expected inflation rate. In response to monetary policy reaction implied by the Taylor rule, agents alter their expectations about future inflation through forward-looking behaviour and thereby anchor the current inflation rate as well.
In the backdrop of chronic high inflationary pressure in India, anchoring inflation has emerged as one of the major challenges of RBI in recent years. In this context, our findings highlight the potential for an inflation targeting monetary policy to anchor inflation expectations in India.
References Bhattacharya, R., I. Patnaik, 2014. Monetary Policy Analysis in an Inflation Targeting Framework in Emerging Economies: The Case of India, Working Paper No. 131, NIPFP, New Delhi (February). Bhattacharya, R., I. Patnaik, A. Shah, 2008. Early Warnings of Inflation in India. Economic and Political Weekly XLIII (49); 62–67. Laxton, D., D. Rose, A. Scott, 2009. Developing a Structured Forecasting and Policy Analysis System to Support Inflation-forecast Targeting (IFT), Working Paper 09/65, International Monetary Fund, USA.. Patnaik, I., 2007. The Indian Currency Regime and its Consequences, Economic and Political Weekly, 42 (11); 911-913. Zeileis, A., A. Shah, I. Patnaik, 2010. “Testing, Monitoring, and Dating Structural changes in Exchange Rate Regimes”. Computational Statistics and Data Analysis, 54(6); 1696–1706.
|


