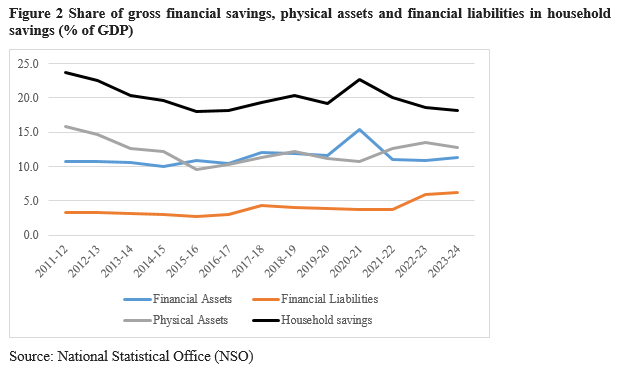
In the years post Covid-19 household savings and investment behaviour has received much attention. There have been concerns of growing debt. Banks have expanded their lending to households, particularly in the category of housing loans. The share of personal loans in total non-food credit by households increased from 21.27% in 2014-15 to 32.8% in 2024-25. This was accompanied by an increase in share of housing loans and the category of other personal loans, which together account for 76.1 % of all personal loans.
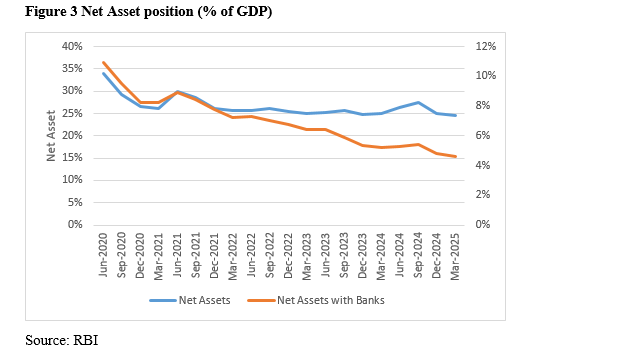
The growing propensity to take on more credit merits a closer examination of asset and liability position of the largest contributor to savings and investment in India. The increase in borrowings by households has impacted the net financial asset holdings of households. In the years after 2011, household gross savings have declined relative to GDP from 23.6% to 18.2%. (Figure 2) This has been accompanied by a decline in net financial savings, especially after 2021-22. Household savings held as physical assets also decreased till 2015-16, after which there is some recovery. Nevertheless, physical assets are still the largest category, accounting for 70.3% of household savings.
The increase in financial liabilities that includes borrowings, after 2021 have material impact on the net financial asset position of households. As is observed from the quarterly data, (Figure 3) the share of net assets stabilised at a lower level when compared to June 2021. In contrast, the net assets with banking sector shows a consistent decline. In the aforementioned period, households tend to borrow more from banks than contribute to deposits – the ratio of deposits to credit for household sector has declined from 1.84 to 0.76 - and this indicates rising banking claims on households. While there was a correction in September 2024, the trend was observed until March 2025.
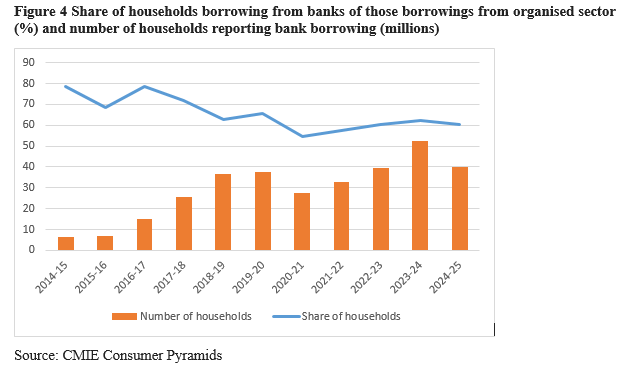
The increase in household borrowings raises the question of who is borrowing and for what purpose. RBI data suggests housing loans have picked up in the personal loans category. To understand the source of demand across different households CMIE consumer pyramids data provides information on proportion of households that are reported to have borrowed from banks and by the purpose of the borrowing. These two factors are important, as they provide an insight into the income categories of households that are borrowing and the purpose. (Figure 4) The share of banks in households accessing borrowings from organised sources remains high at 60.06%, though it declined from 2014-15, suggesting that non-bank institutions from the organised sector have occupied a growing share. In fact, the total number of households reporting bank borrowing declined in 2024-25.
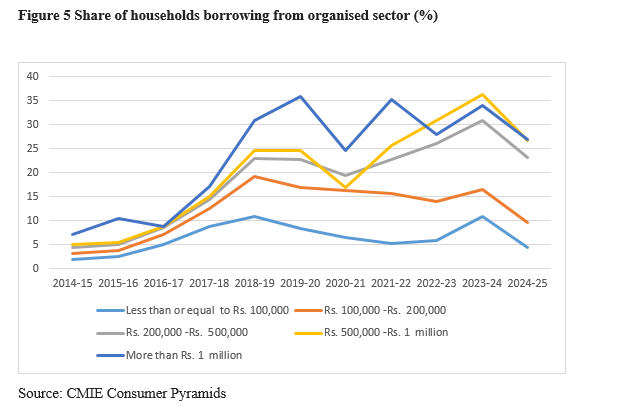
Even though the overall share of personal loans from banking has increased, the share of households reporting bank borrowings has declined. Figure 5 shows the share of households in each income category reporting borrowing from the organised sector. The data suggests that for households reporting income less than Rs 200,000, a decline in share of households accessing credit from the formal sector is observed since 2018-19, while that of households with higher incomes has increased. The growth in number of households accessing credit from organised sector has been fastest among the income category of 200,000 to 500,000.
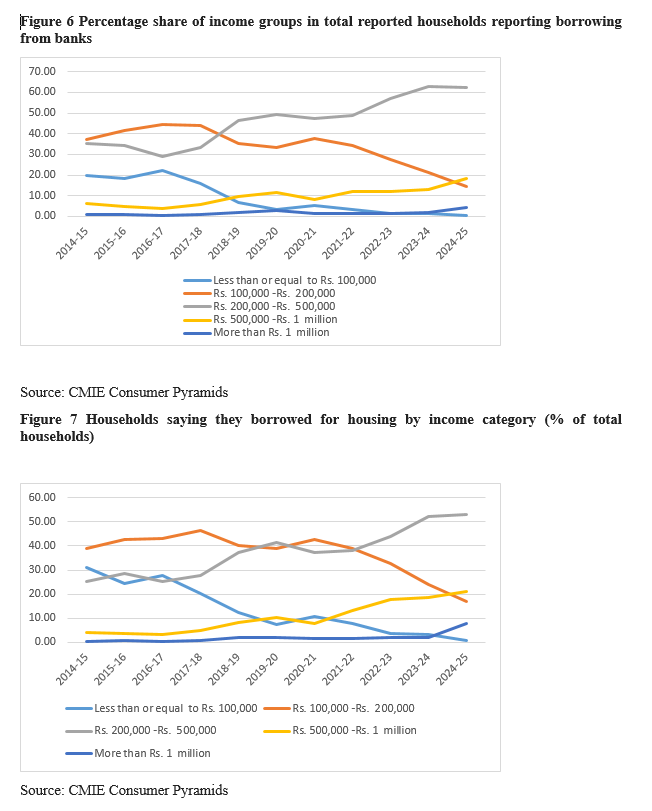
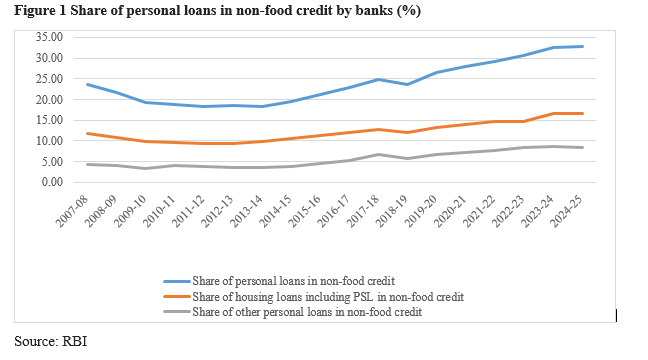
Similar trend is observed for loans from banks and for housing. Of the households borrowing from banks, the households with income less than Rs 200,000 has declined sharply while that of higher income groups has increased. (Figure 6) The similar trend is in evidence for composition of households reporting borrowing for housing. (Figure7) Thus the rise in banking loans is accompanied by fewer households reporting borrowing, particularly in the lower income categories. This could imply that the average loan size has increased.
The implications for household indebtedness and for bank exposure to household debt
1. Lower income households seem to have been eased out of the organised sector for credit – the share of households accessing credit has declined from 10 percent to 5 percent for households with income less than Rs 100,000 and from 19 percent to 9 percent for the next income category. An important question to ask whether these households are not demanding credit or whether they have been nudged towards informal credit. From CMIE consumer pyramids data, it apparent that proportion of households raising credit from unorganised sector exceeded those relying on organised sector for the incomes below 2,00,000 in all years, except 2024-25, as compared to the higher income groups. Important questions on access to credit need to be addressed.
2. For the banking sector, lower exposure to low income households could imply lower risk. It could also mean better collateralised credit. The emerging moderation in the size of banking sector in total credit supply in the economy as well as lower exposure to this component of risk could mean a gradual change in the role of banking in the economy.